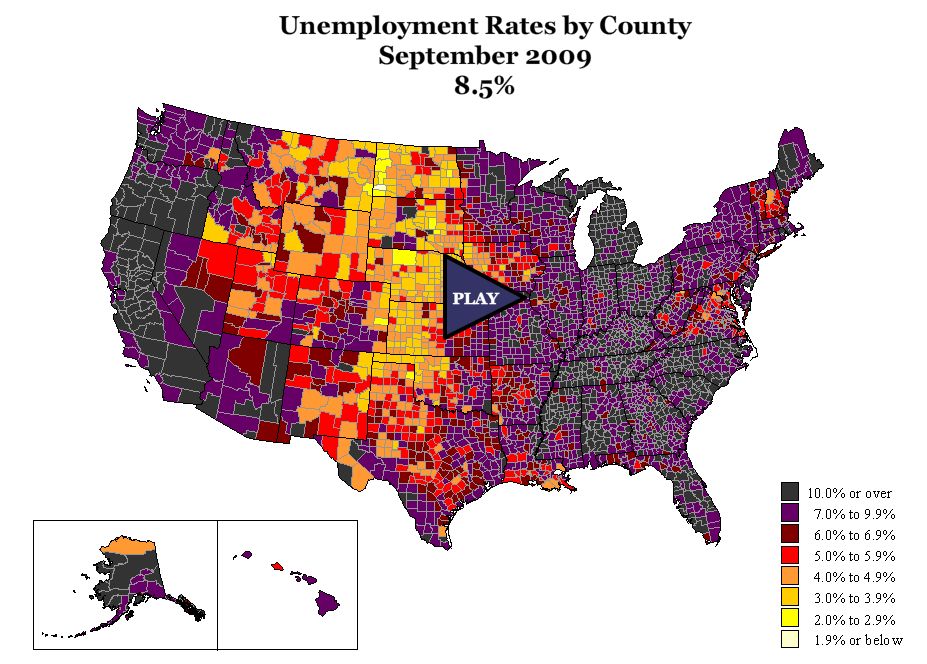
Click the image to see the unproductive scourge of recessionary unemployment come sharply into focus, county by county (time-lapse chart runs 30 seconds). As far as we can tell, the figures are based on the BLS U3 measurement and thus don't show the true nature of job destruction that is reflected by U6 (17.5%). Also, since these figures come from BLS they don't reflect the recently announced mea culpa on the birth-death adjustment for '09 of 824,000 phantom jobs.
Definitely impressive, but it lacks the action of this piece.
------
PLEASE email, facebook, re-tweet, share and take our stories with you when you leave. Our only weapon against the madness is GREATER AWARENESS. Thank you.